Level 2: Technical Analysis Mastery Intermediate
Stop guessing and start understanding the language of the market. Learn how professional traders decode charts to identify high-probability trading opportunities.
Welcome to the intermediate level of Trading Ek Mission. After learning the fundamentals of the stock market in Level 1, this course will teach you how traders actually analyze charts and make trading decisions. Technical analysis focuses on studying price charts, patterns, and indicators to understand market behavior. Instead of relying on random tips or news, traders use structured tools to evaluate the market logically. In this course you will learn how to read candlestick charts, identify market trends, analyze support and resistance levels, and use powerful indicators such as RSI, MACD, and Moving Averages. By the end of this course, you will have the ability to interpret charts confidently and recognize potential trading opportunities based on market structure, momentum, and trader psychology.
View Complete SyllabusWhat You Will Master in This Intermediate Course
Core Chart Skills
- Understanding Candlestick Charts and what they reveal about price movement.
- Identifying strong Support and Resistance levels.
- Drawing Trendlines to detect market direction.
- Understanding how price structure reveals buyer and seller behavior.
Essential Indicators
- Mastering the RSI indicator to identify overbought and oversold conditions.
- Using MACD to confirm trend momentum.
- Understanding Moving Averages for trend confirmation.
- Using Volume analysis to confirm strong price movements.
Strategy & Discipline
- Using Multi-Timeframe Analysis to confirm trades.
- Recognizing powerful chart reversal patterns.
- Applying strict Risk Management.
- Building a structured Trading Plan and Journal.
Complete Technical Analysis Syllabus
-
1. The Core Philosophy: What is Technical Analysis?
Technical analysis is the study of price charts to understand market behavior. Instead of focusing on company financials, technical traders analyze patterns, price action, and volume to predict future price movements.
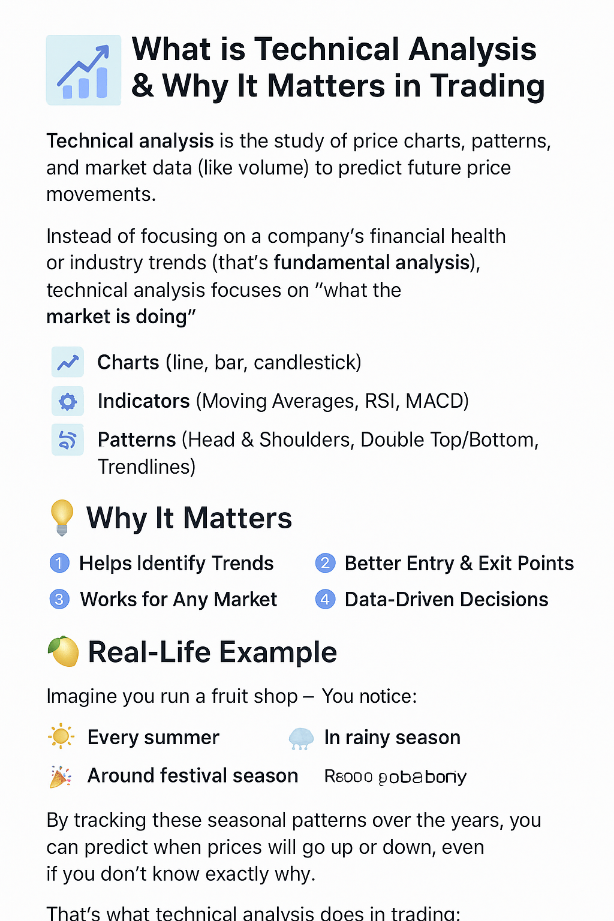
The Three Pillars of Technical Analysis
- Market Action Discounts Everything: All available information is already reflected in price.
- Prices Move in Trends: Markets tend to move in identifiable trends.
- History Repeats Itself: Human psychology creates repeating chart patterns.
-
2. Candlestick Charts: The Trader's Language
Candlestick charts visually represent the open, high, low, and close price of an asset during a specific timeframe.
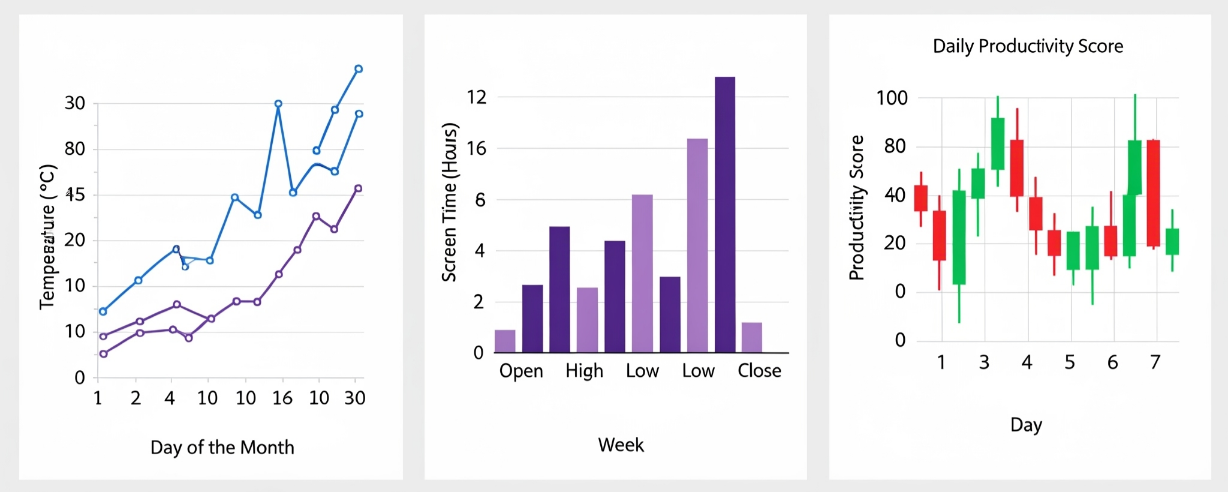
- Green Candle
- Closing price is higher than opening price.
- Red Candle
- Closing price is lower than opening price.
- Wicks
- Show the highest and lowest price reached.
-
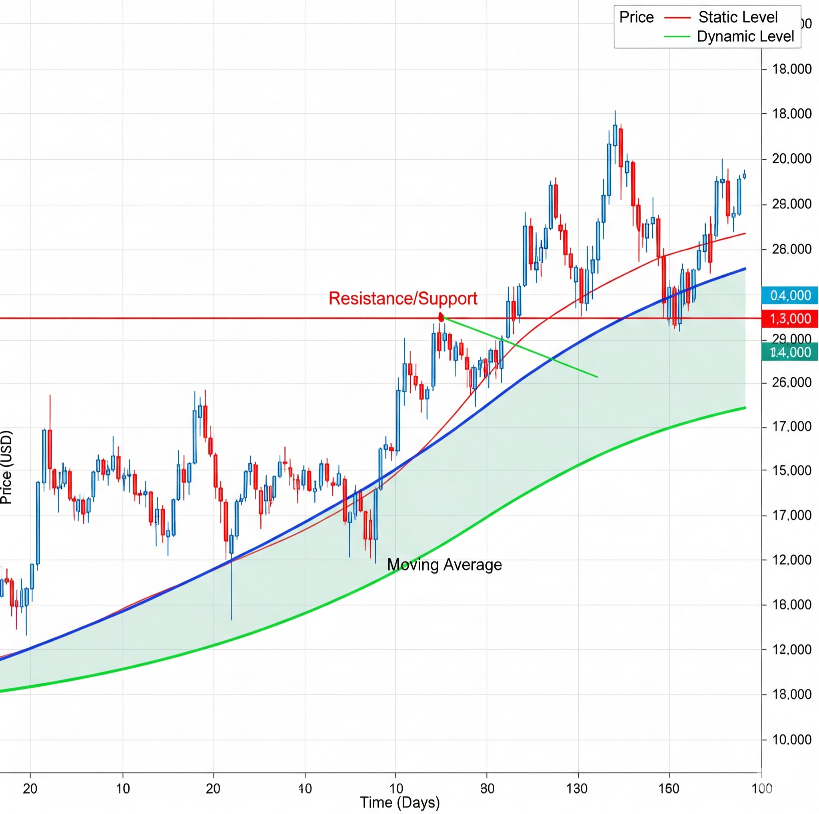
3. Support & Resistance: The Market's Psychological Zones
Support and resistance levels are areas where price tends to reverse due to strong buying or selling pressure.
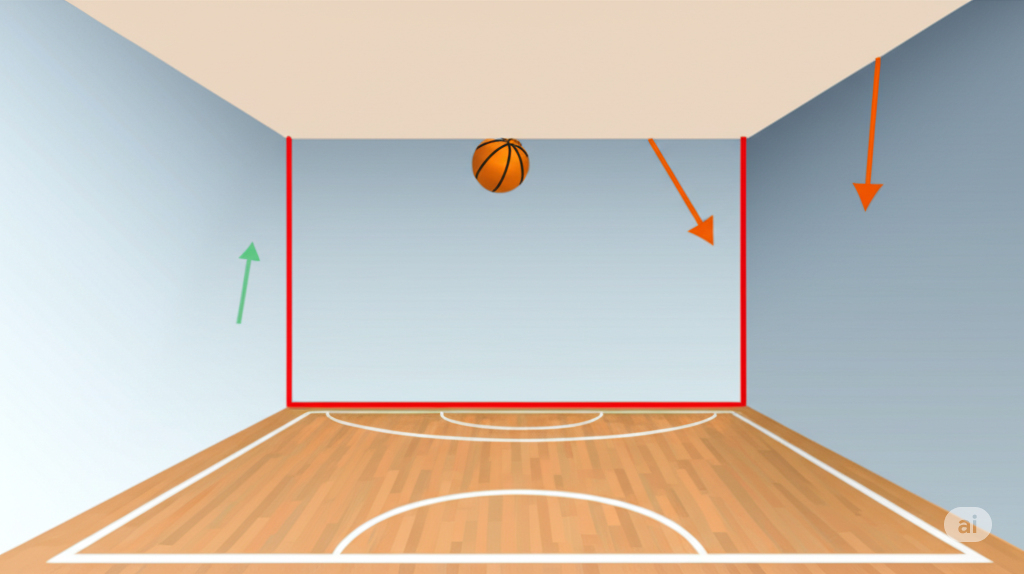
- Support acts as a price floor.
- Resistance acts as a price ceiling.
- Broken resistance can become new support.
-
4. Trend Analysis: Identifying Market Direction
Trends show the general direction of price movement. Understanding trend structure is essential for trading success.
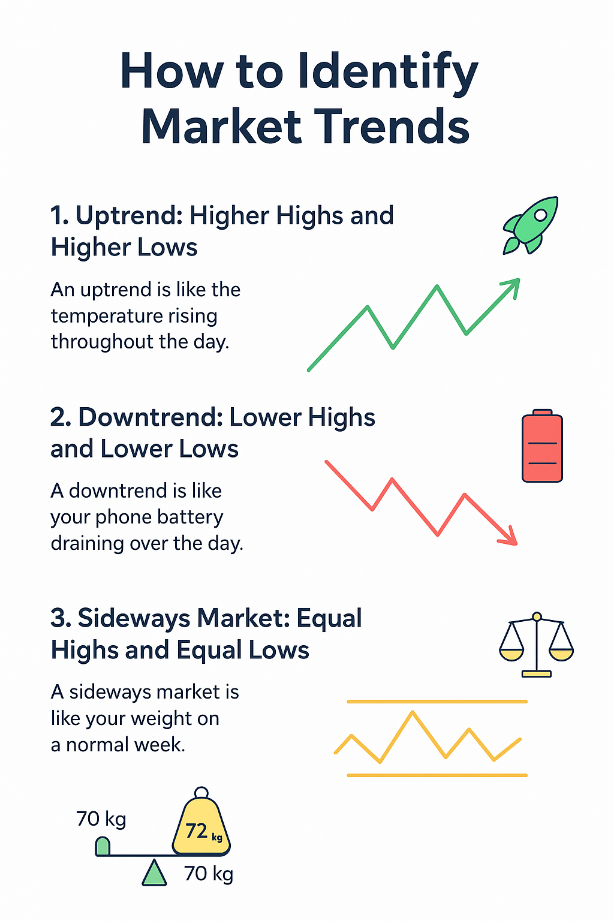
- Uptrend = Higher Highs & Higher Lows
- Downtrend = Lower Highs & Lower Lows
- Sideways Market = Range between support and resistance
-
5. Trendlines & Channels
Trendlines help traders visualize price direction and identify potential entry and exit points.
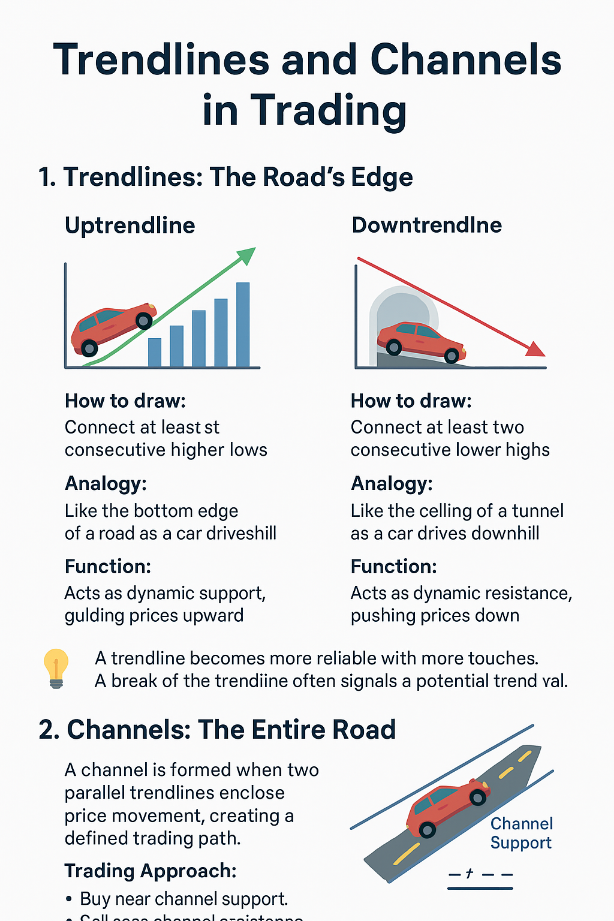
- Uptrendline connects higher lows.
- Downtrendline connects lower highs.
- Channels show price movement boundaries.
-
6. Multi-Timeframe Analysis
Professional traders analyze multiple timeframes to improve trade accuracy.

- Identify main trend on higher timeframe.
- Find support/resistance on mid timeframe.
- Enter trade on lower timeframe.
-
7. Moving Averages
Moving averages smooth price movement and help identify trend direction.
- SMA – Simple Moving Average
- EMA – Exponential Moving Average
- Golden Cross signals strong bullish trend
-
8. Relative Strength Index (RSI)
RSI measures momentum and indicates whether a stock is overbought or oversold.
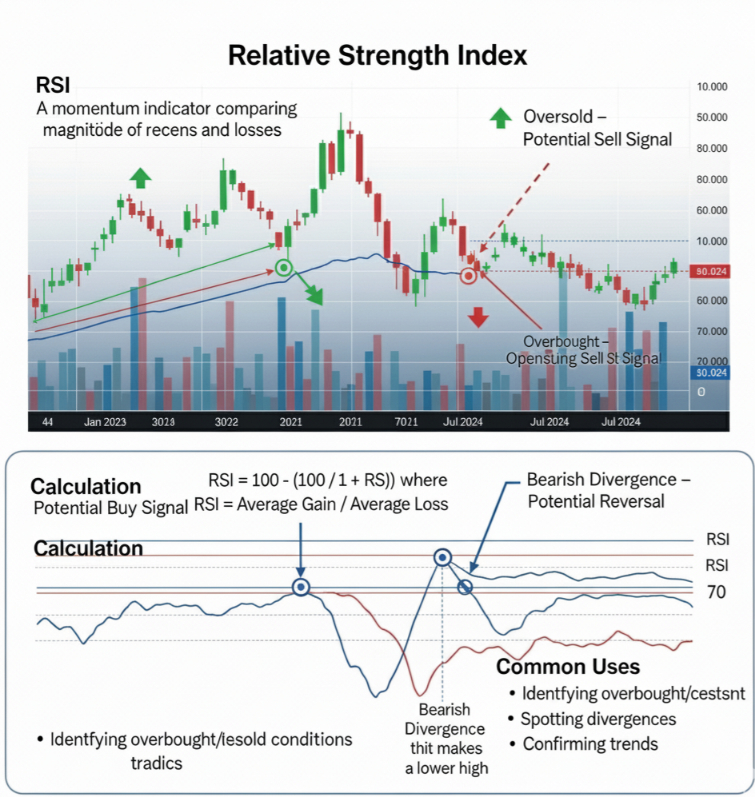
- RSI above 70 = Overbought
- RSI below 30 = Oversold
- Divergence can signal trend reversal
-
9. MACD Indicator
MACD helps traders identify trend direction and momentum changes.
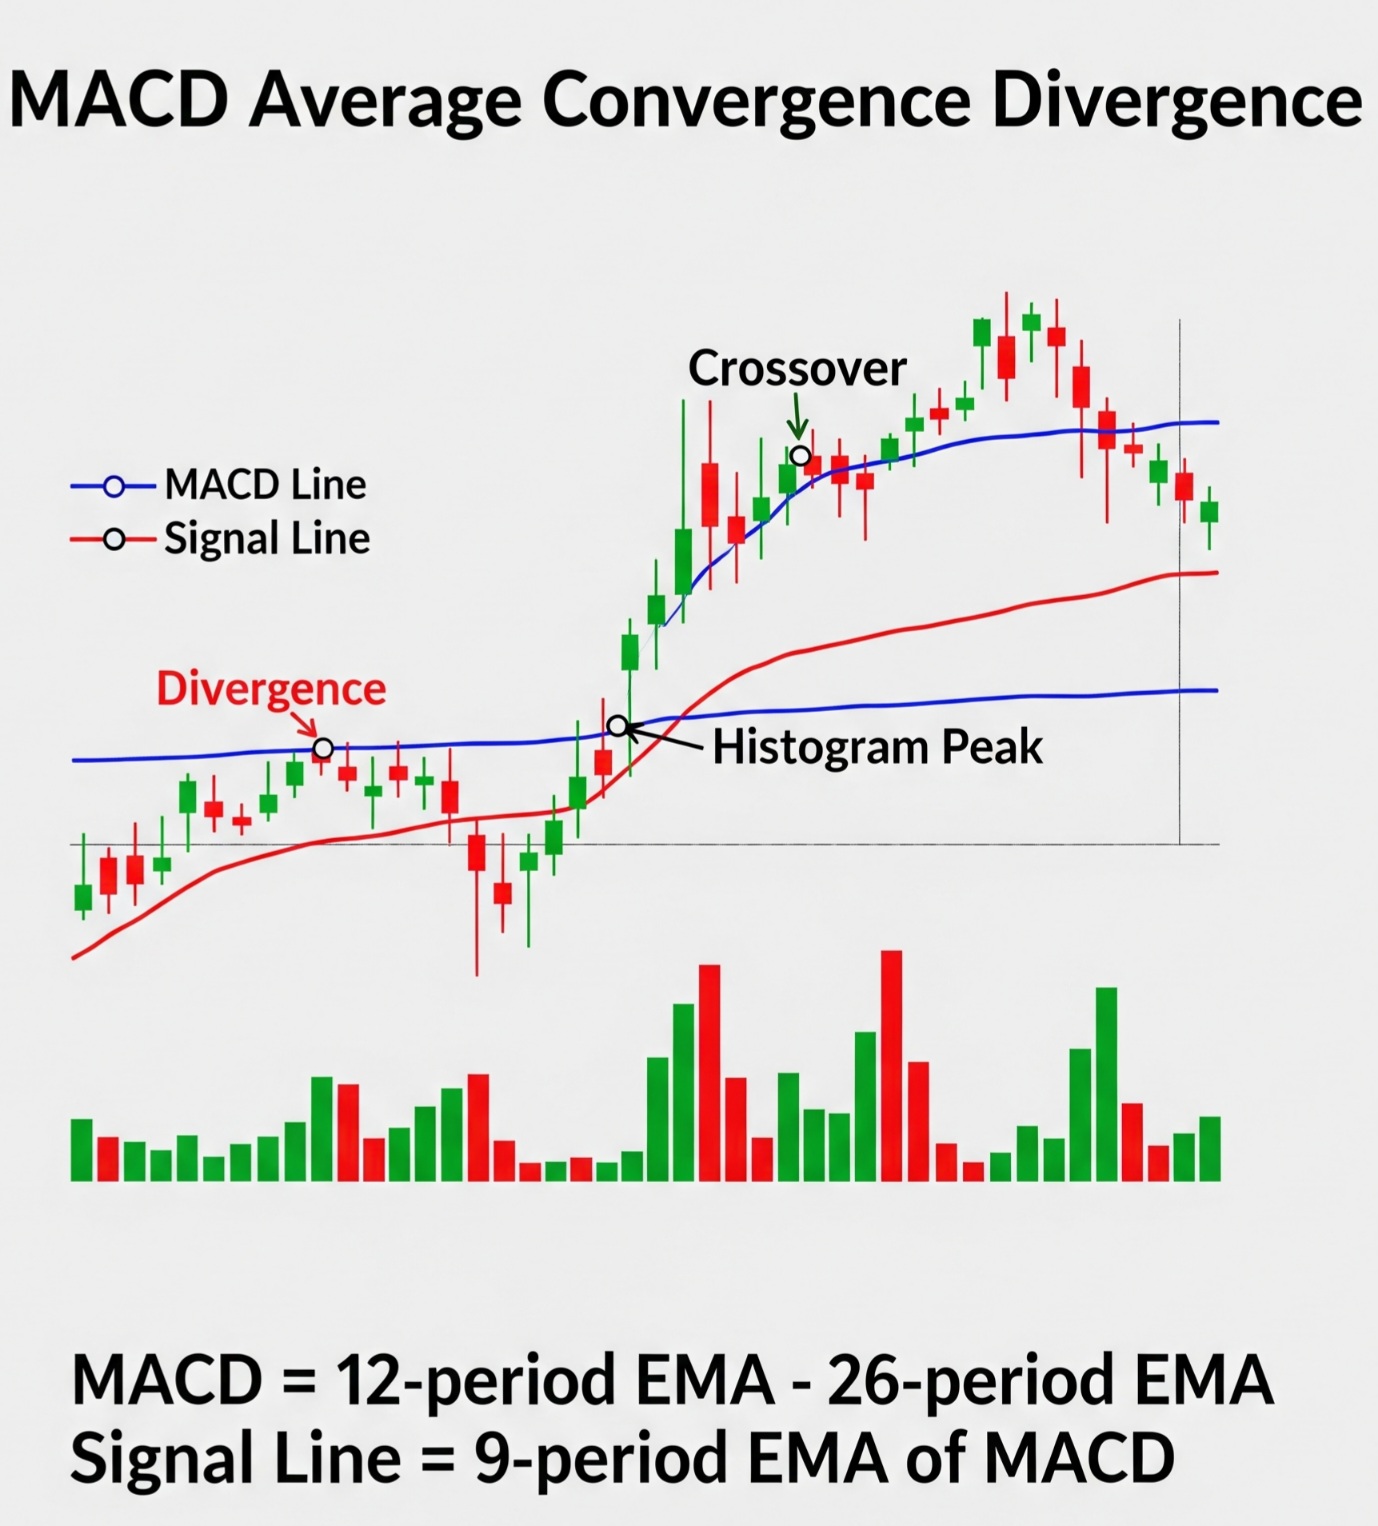
- Bullish crossover = buy signal
- Bearish crossover = sell signal
- Histogram shows momentum strength
-
10. Volume & Volatility
Volume confirms price strength while volatility measures how fast prices move.

- High volume confirms strong moves
- Low volume signals weak trend
- Volatility increases risk and opportunity
Test Your Technical Analysis Knowledge
You have completed the lessons of the Technical Analysis Course. Now it's time to test your understanding with the final quiz.
Score well in the quiz to prove your knowledge and continue your journey toward becoming a disciplined trader.
🧠 Take Technical Analysis QuizReady to Master Technical Analysis?
Continue practicing chart reading and apply disciplined trading strategies. Technical analysis is a skill that improves with consistent practice and observation.
Enroll in Level 3 Course Now